

If you have been following my sales updates you will know that I now use Flippedit to track my inventory and sales. But when I started this, I had no money and wasn’t making enough to justify a subscription service.
When I first started I was using google sheets, which is a free online version of Microsoft Excel.
It was a very simple table, it was organized by category, which was in my opinion a pretty stupid way to organize it, but I wanted to see what I sold the most of. This is just a little screen grab of my sold tab so you can see what information I had in the table.

Whilst flipped it gives you a great overview of your financial position. It is still relatively new and doesn’t have all of the information that I like to see. I still like to see how many items I have in each category, so I can see where I need to improve. So even thought I am paying for inventory software, I do still have my spreadsheet. I have separate pages for every category, this is an example of what my skirt page looks like.

As you can see, it is still pretty simple, but it tells me I have 27 skirts listed, now that Summer has ended, my spreadsheet also tells me that I only have 13 jackets/jumpers for sale. So that is something I want to look at increasing as we go into the cooler months. Once an item sells, I take it from that page and pop it into the sold tab, which looks like this.

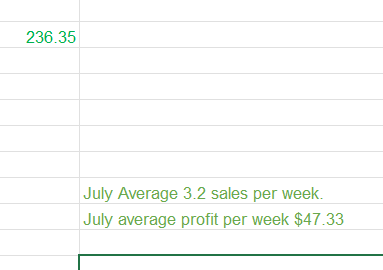
I have different colours depending on where I got the item. Red is purchased for profit. Black is something I already owned, and Pink are things I sold from my fathers estate. Then at the end of each month, I would work out my total profit, average profit per week and average sales per week. Which would look like this.
This is really is all you need. You want an idea of how long things have been listed and how long something takes to sell. You also obviously need to be seeing what your profit is.

Leave a comment